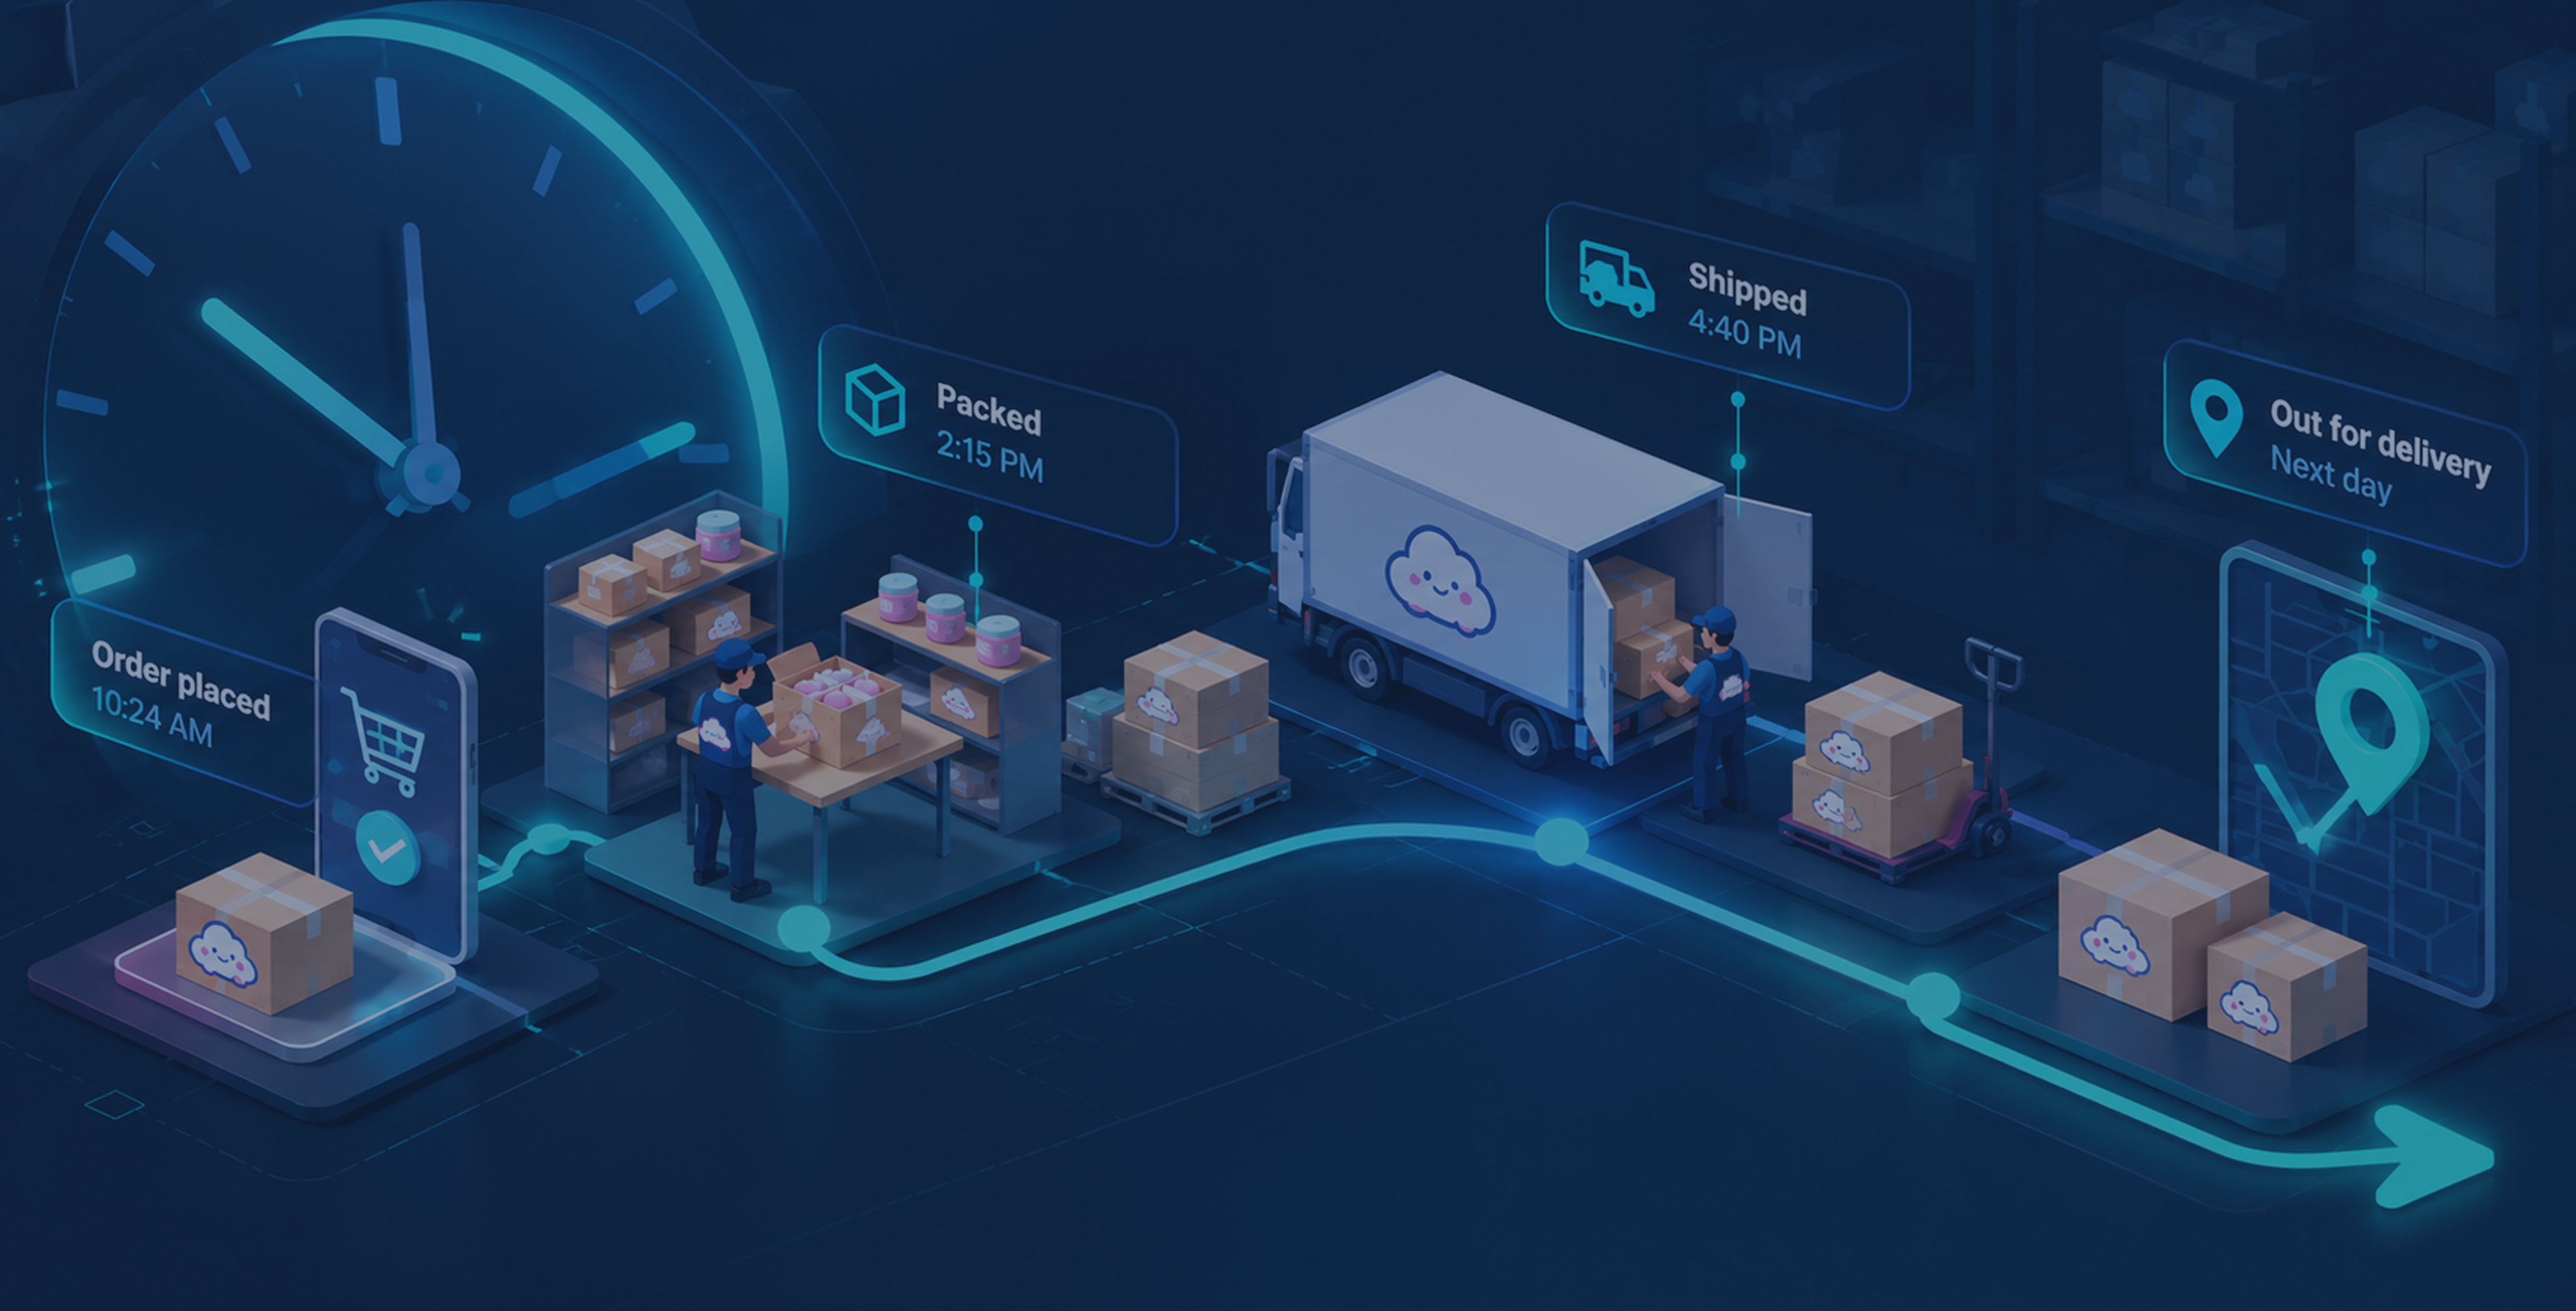
Case Study
Fulfillment speed shouldn't be a surprise!
KAWAII SLIME COMPANY × AUTOBIZZ
Kawaii Slime Company sells through a retail store and a wholesale store, yet nobody could directly say how long each orders have been fulfilled to deliver to the customers each day. The only answer was one dashboard figure which was showing a sum-up hours for past one week and past month. AutoBizz turned that number into a weekly team briefing and leadership report, both delivered automatically.
“See the delay sooner by making better decisions faster”
Client
Kawaii Slime Company
Sector
E-commerce
Solution
Fulfillment & Operations Reporting
Timeline
May 2026
AutoBizz gave Kawaii Slime Company an automated pulse on order fulfillment speed
AutoBizz built an automated reporting system that measures how long KSC's team takes to fulfill orders across its retail and wholesale stores. Every week, the team receives a short briefing with average fulfillment time, sales channel wise fulfillment times. Both stores now sit in one KPI hub, so it can be answered that what is happening in the stores, within how much hour orders are being fulfilled.
- Order Fulfillment Tracking
- Sales Analytics
- Operations Dashboard
- Workflow Automation
- KPI Briefings
- Slack Message Alert
The Situation
Fulfillment gaps appeared every day, with no way to track them
KSC runs a retail store for shoppers and a wholesale store for business buyers. Both take orders and ship every day. Yet the simplest operational question, how quickly are we getting orders out, had no ready answer when the manager needed it to know.
Services We Provided
- Business Intelligence
- Reporting Automation
- Customized Dashboard Development
Old Routine
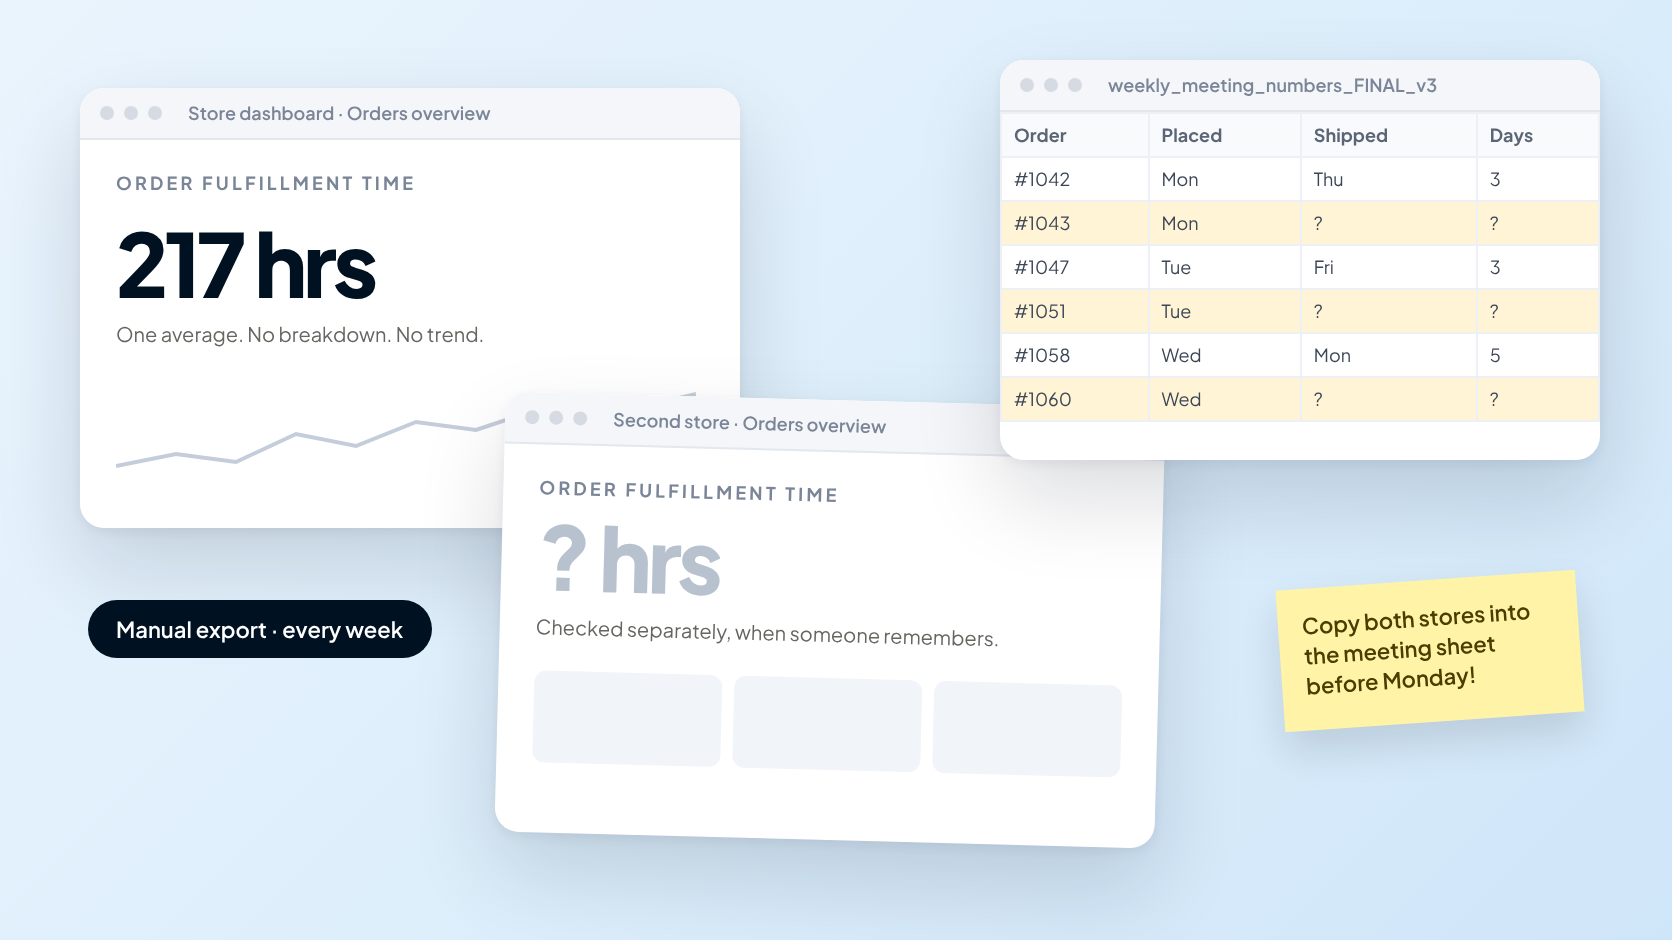
- 01Open each store's dashboard and look for the individual fulfillment hours
- 02Export order lists when the dashboard figure raised questions
- 03Work out manually to findout which orders had waited too long
- 04Copy sales and shipping figures into a separate meeting sheet
- 05Repeat the same steps for the second store, then compare
None of it was difficult, but all of it was lengthy process. By the time numbers reached a meeting, they described last week, not what customers were experiencing today.
‘The dashboard was telling fulfillment hours. What it could not say was which orders were waiting,why is't taking time and since when.’
The Challenge
Slow fulfillment wasn't the problem. Not seeing it in time was
A single average time hid the full story, so delays were noticed only after customers had already started asking questions.

- Day zeroAn order is placed and joins the queue
- Days laterIt sits unpacked while newer orders take attention
- Later stillThe store average creeps up without anyone noticing
- Too lateThe customer writes in asking where their order is
- Trust spentA nine-day wait quietly costs the next order
System Architecture
The System Design Board




SEE THE DELAY BEFORE IT BECOMES A CUSTOMER PROBLEM
The Turning Point
The reports now come to the team automatically
KSC didn't need another dashboard to check. They needed the right numbers to arrive on their own, every week, for both stores, in plain language. Each figure is measured the same way the store measures it, so the team can trust it and act on it immediately.
Interface Portfolio
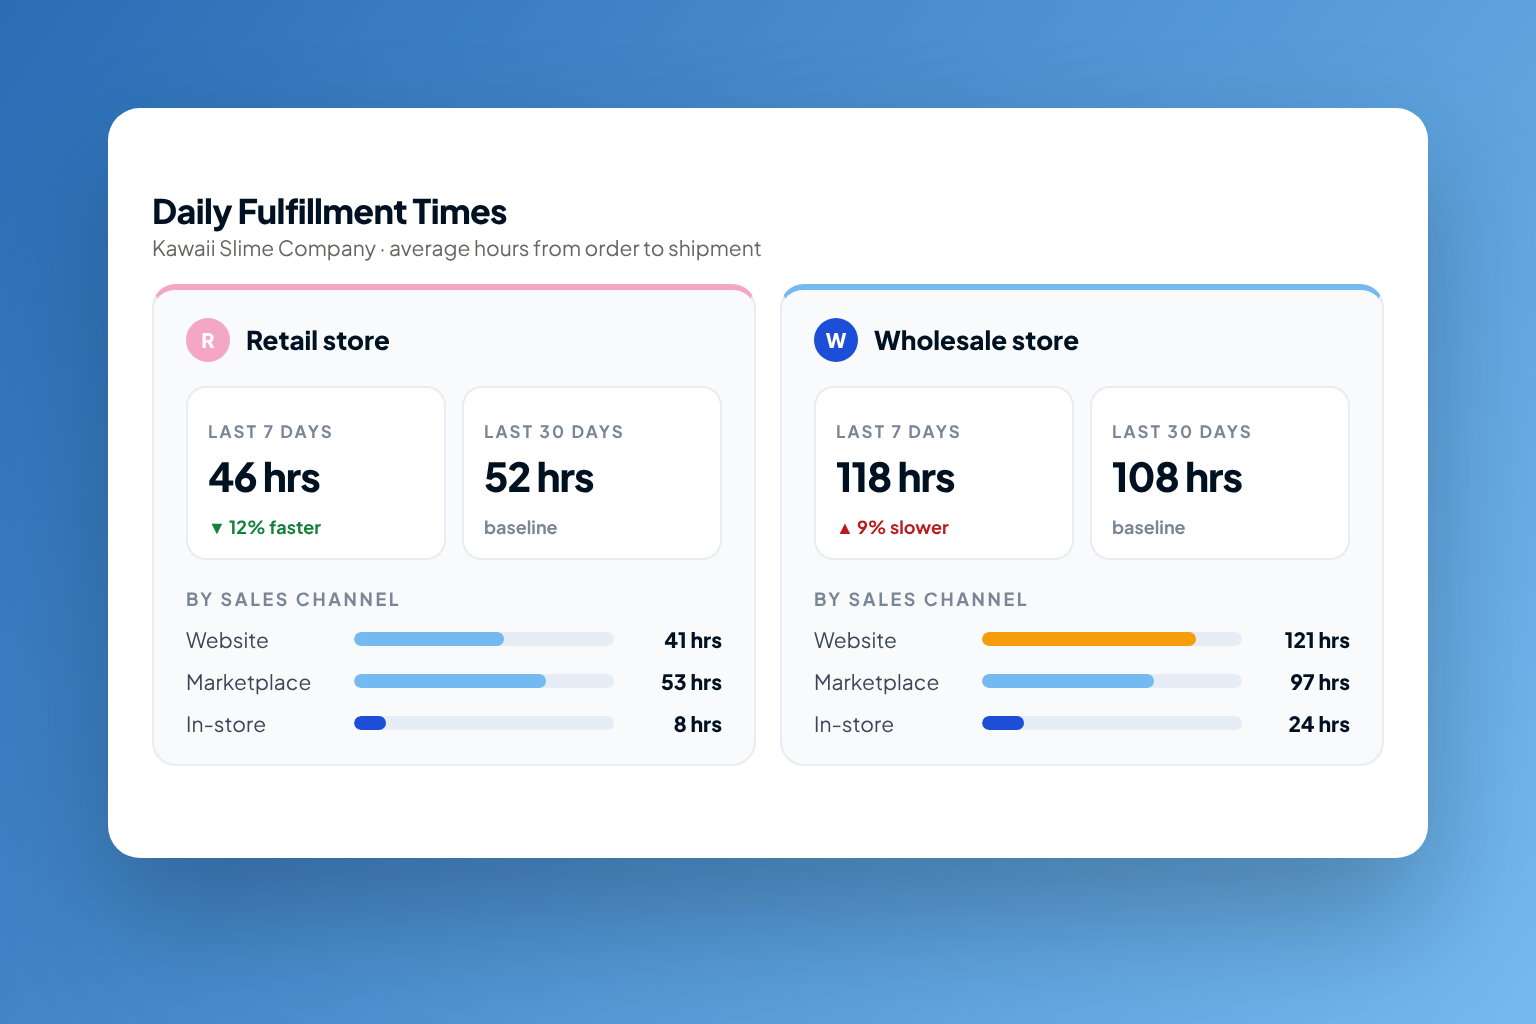
Automated fulfillement reporting system working on schedule
The Solution
Every order tracked, every store measured, less delayed fulfillment
AutoBizz built the reporting around one principle: the numbers leadership relies on should arrive on their own, already checked, and in words anyone on the team can act on.
01
The Stopwatch
Order Fulfillment Time
Every order is timed from the moment it is placed to the moment it ships, and to delivery where that date exists. The result is one average both stores can trust.
02
The Cross Check
Matched to the Store Dashboard
Before going live, every figure was compared against the number the store already reports, so the team never has to wonder which number is right.
03
The Weekly Brief
Weekly Fulfillment Update
Each week the team receives average fulfillment time, orders waiting more than three days and orders shipped yesterday, for each store.
04
The Trend Line
Day-Over-Day Comparison
Every figure sits next to the previous day, so the team sees at a glance whether fulfillment is improving or slipping.
05
The Open Door
Built to Grow
Both stores now reports in one KPI hub, so it can be answered that what is happening in the stores, within how much hour orders are being fulfilled.
06
The Boardroom Pack
Weekly Operations Report
Average fulfillment time, Sales channel wise fulfillment times for every week now arrives in one report.
What Changed
From guessing to knowing, every single week
Before
Now
Before
Fulfillment time hidden inside one dashboard figure
Now
Fulfillment time delivered to the team and manager every week
Before
Each store checked separately, when someone remembered
Now
Both stores reported side by side, automatically
Before
Late orders discovered when customers complained
Now
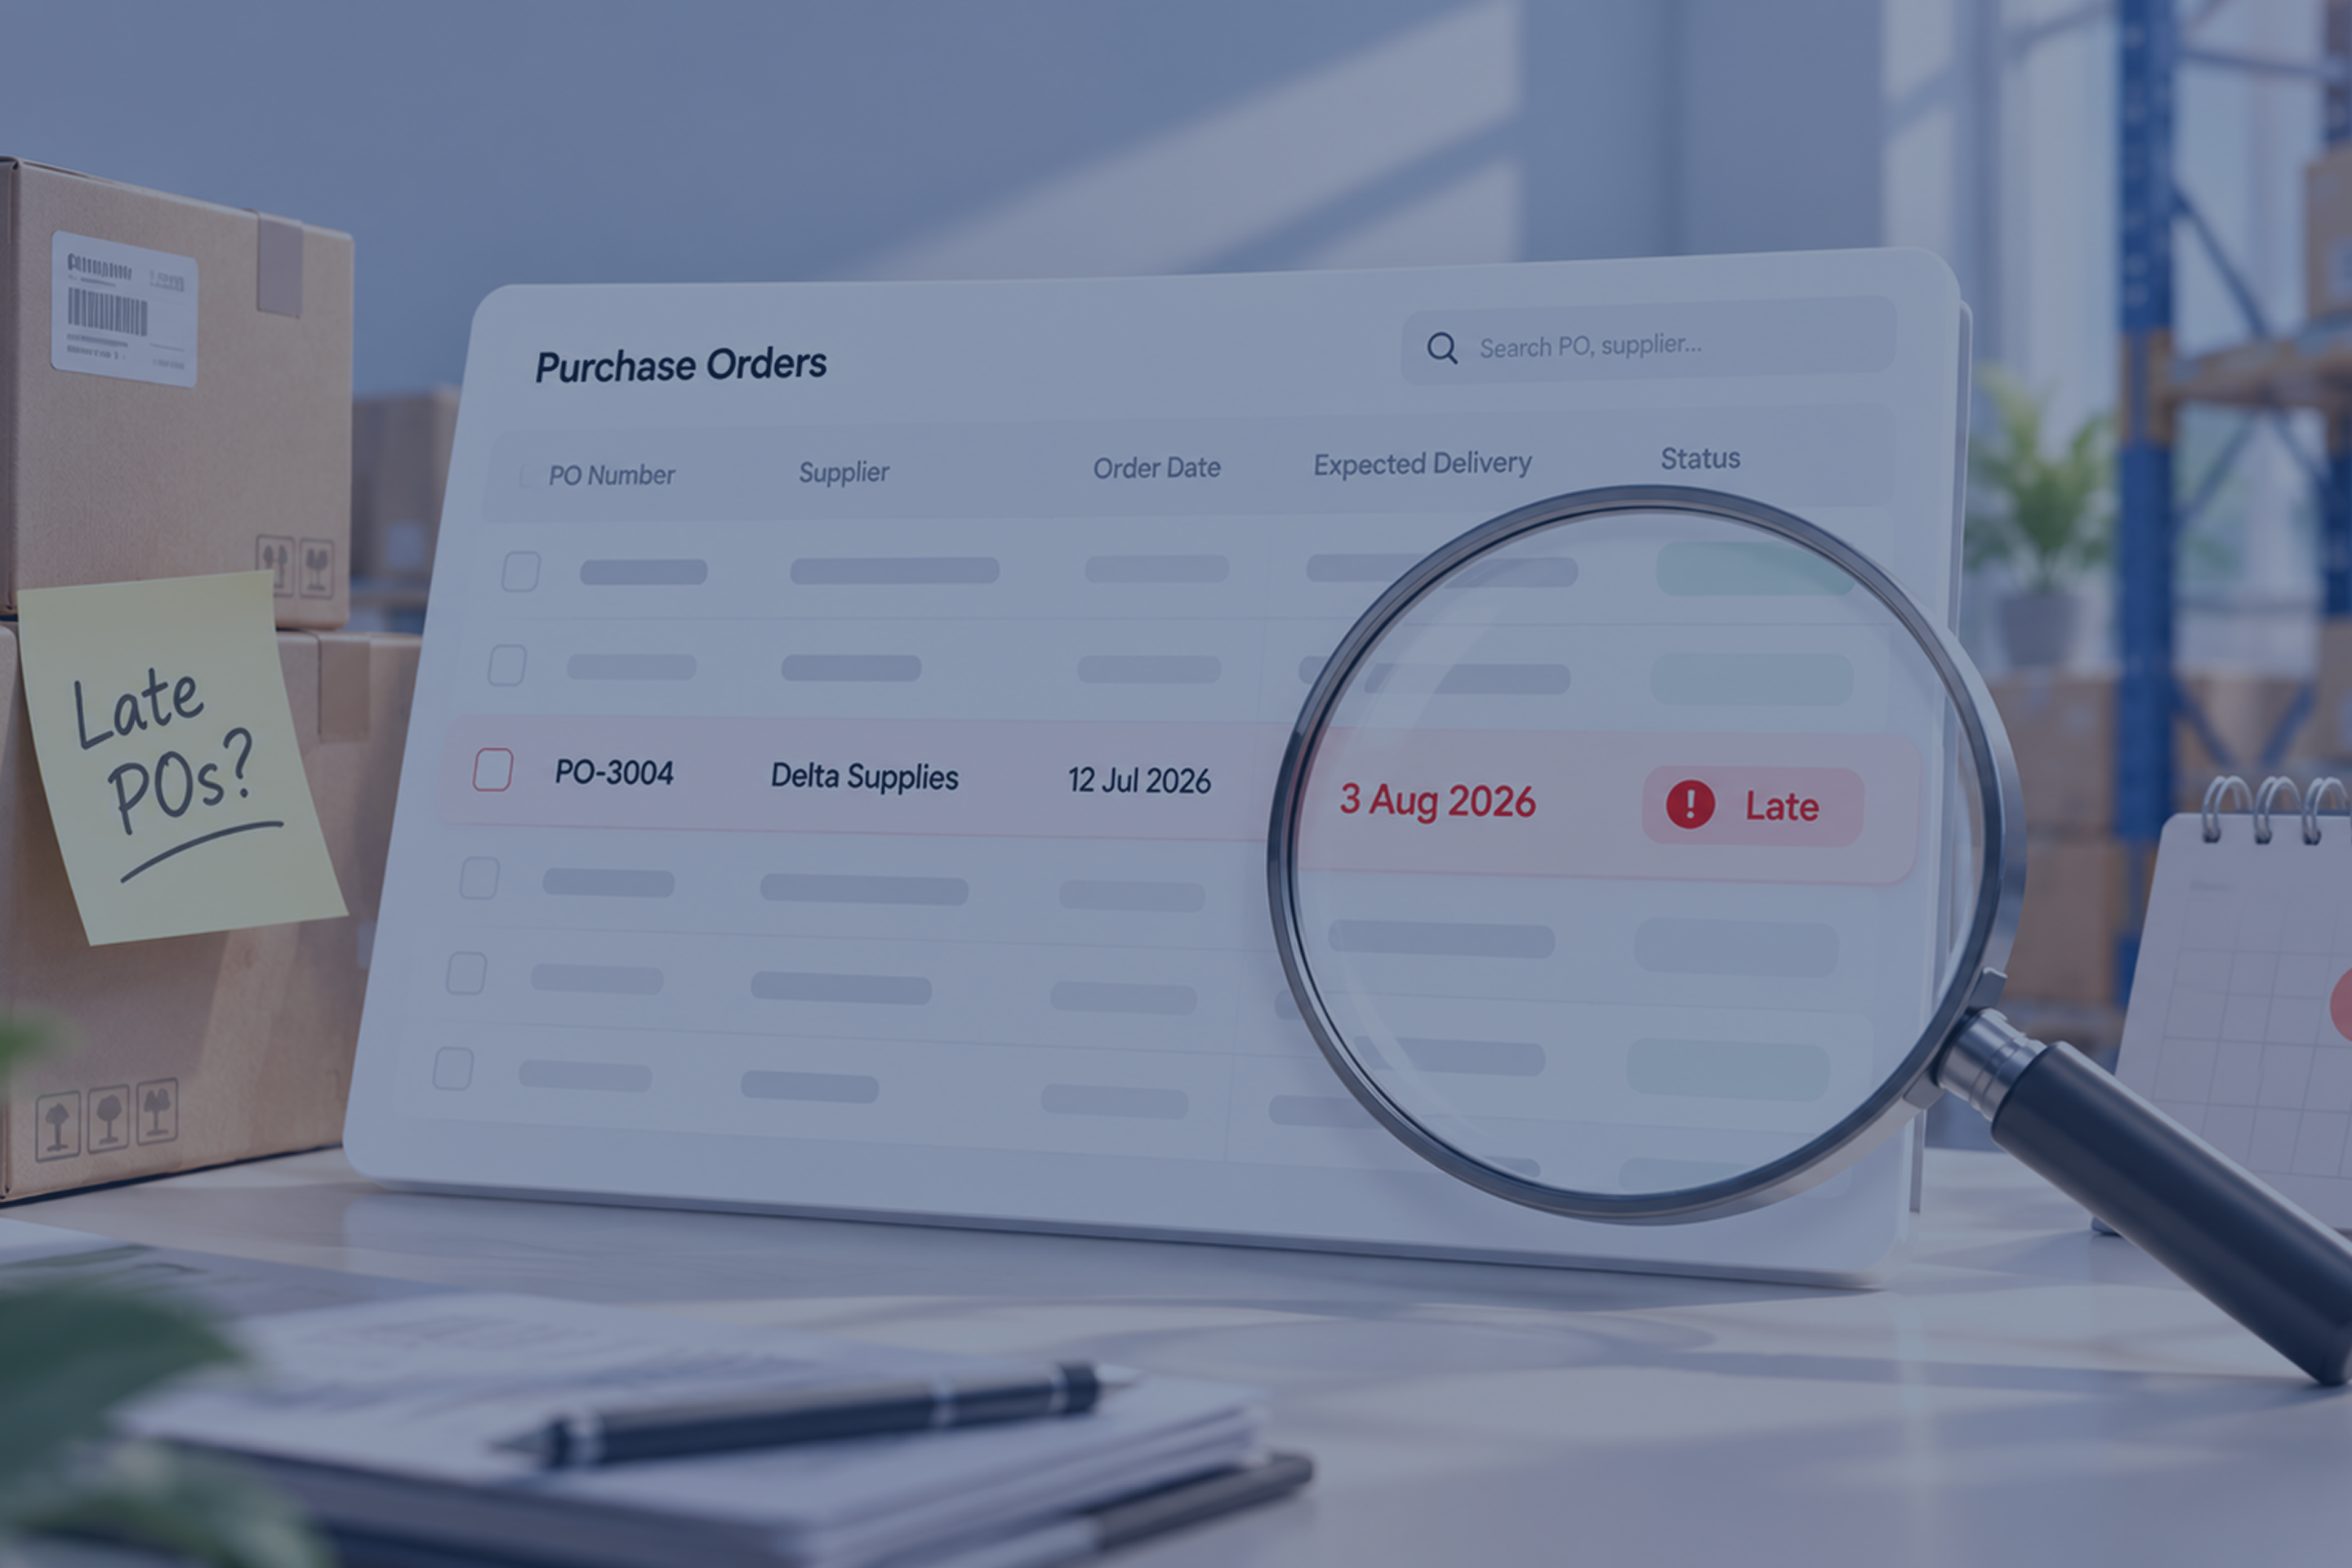
Late Orders can be precisely flagged on each report
Before
Meeting numbers rebuilt by hand every week
Now
Leadership receives a ready weekly operations report

The Results
Visibility that runs on its own
3-4
Late orders caught per week
Orders waiting flagged before customers asked.
25%
Faster fulfillment
Orders are now reach shipment faster across both stores, monitored efficiently
3 hrs
Saved weekly
Time no longer spent pulling and preparing meeting numbers.
Recent Case Studies


References
Documentation this build relies on
- 01
Order Data Documentation
Used to read order, fulfillment and delivery dates for both stores.
View Source - 02
- 03
Store Analytics Reports Guide
Used to match our fulfillment figures with the store's own dashboard.
View Source - 04
Team Message Alerts Documentation
Used to deliver the weekly fulfillment briefing to the team.
View Source

Get Started
Ready to automate your operations?
If your team is still spending hours updating spreadsheets, chasing suppliers or manually monitoring operational data, AutoBizz can help turn that process into a connected automated system.
Frequently asked questions
Still have questions? Book a call and we'll answer anything.
What is order fulfillment time?
Can fulfillment time be tracked automatically for more than one store?
How do you make sure automated numbers match the store dashboard?
What goes into a weekly sales and operations report?
What should a fulfillment report include?
Can new KPIs be added to the reporting later?