
Case Study
Behind a changing warehouse, outdated numbers told the wrong story.
KAWAII SLIME COMPANY × AUTOBIZZ
Every internal topping bin variant at Kawaii Slime Company carried the same par level of 4,000 units and an alert threshold of 2,000, whether it moved fast or barely moved at all. AutoBizz replaced those fixed figures with weekly measurements built from real consumption, calculated separately for two of their stores and written straight back into Shopify.
“The right stock, at the right time, without the guesswork”
Client
Kawaii Slime Company
Sector
E-commerce
Solution
Consumption-Based Par Levels
Timeline
August 2026
Par levels at KSC now follow what the warehouse actually uses
AutoBizz helped KSC keep the right amount of each topping variant in stock without relying on guesswork. We built an automated system that checks the last 30 days of actual sales and stock movements to work out how much each store needs and when it should be restocked. Every week, the system updates these numbers automatically in Shopify, giving each store a more accurate stock plan based on real demand. No manual calculations, no outdated stock targets, just a smarter way to manage inventory and reduce the risk of running out of popular toppings or keeping more stock than needed.
- ShopifyQL
- Shopify
- Google Apps Script
- Shopify Metafields
- Inventory Adjustment History
- MS Excel Online
- Slack
The Situation
A fixed number was applying everywhere
Every internal topping bin variant carried a Par Level of 4,000 units and an Alert Threshold of 2,000. These items were never sold in the ordinary sense. They moved only as transfers from the warehouse to two channels, each at its own pace.
Services We Provided
- Inventory Automation
- Automated Reporting
- KPI Analysis
Old Routine
- 01Toppings transferred from the warehouse to stores
- 02Transfers logged as inventory adjustments, not as sales
- 03Shopify's sales-based tools saw no demand at all
- 04The same 4,000 par level stayed on every variant
- 05The 30-Day Demand Plan read those fixed figures as signal
Nobody had set those numbers wrong on purpose. They were set once, as a reasonable starting point, and then quietly treated as truth because nothing ever measured them again.
‘A par level that never moves is not a plan. It is a guess that everyone has quietly agreed to stop questioning’
The Challenge
Transfers that never touched checkout stayed invisible to Shopify
Because toppings moved by transfer, not by sale, every tool built on sales data looked straight past them.
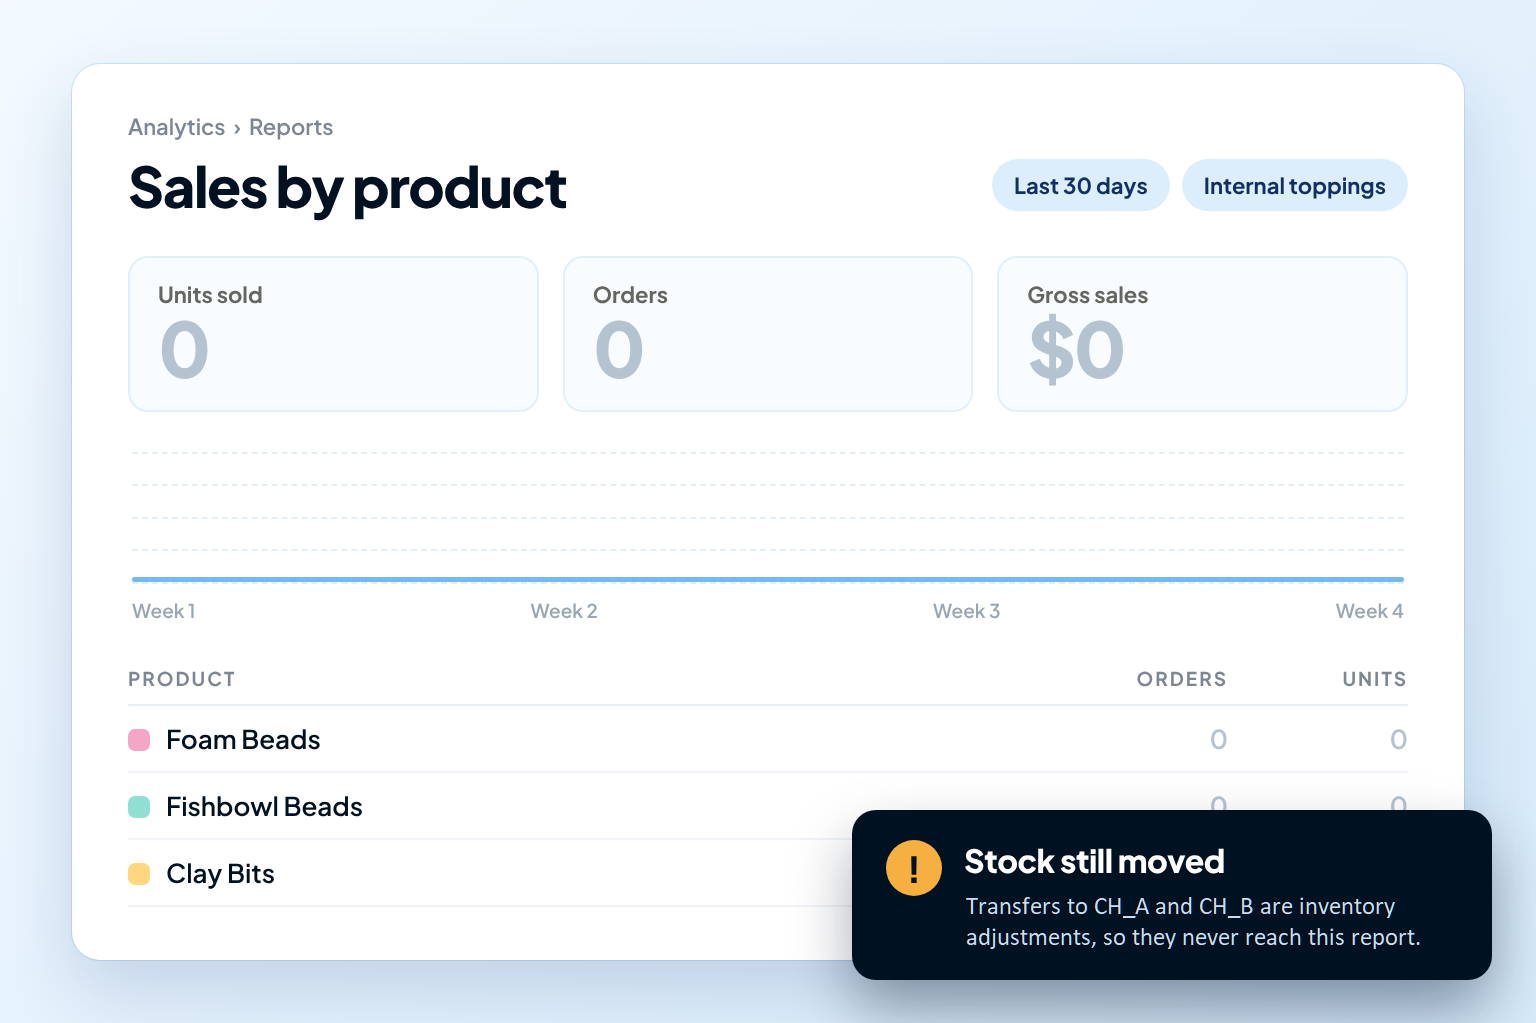
- Day ZeroOne par level of 4,000 and threshold of 2,000 set for every topping
- Weeks laterSlow movers sat overstocked against a par level they would never need
- Later stillFast movers outran an alert threshold that could not see them coming
- Too lateThe 30-Day Demand Plan inherited the stale figures as real signal
- Trust spentPlanning numbers that nobody could explain, and nobody could safely rely on
System Architecture
The System Design Board



SEE THE DELAY BEFORE IT BECOMES A CUSTOMER PROBLEM
The Turning Point
The data was there all along
The answer was sitting inside Shopify. Every product transfers left a record in the inventory adjustment history, even though it never reached a sales report. Reading consumption from those adjustments, instead of from checkout, turned an invisible flow of stock into a weekly measurement.

The Solution
Par levels built from real consumption, every week
Both figures were rebuilt from Shopify's own inventory adjustment history, with separate formulas and the results written straight back into Shopify every week.
01
The Hidden Ledger
Consumption From Adjustments
A tested ShopifyQL query reads 30 days of inventory adjustment history for internal products, capturing corrections, manual adjustments and other movements that never appear as sales.
02
The Fixed Roster
Scoped Product List
The automation runs on a defined list of Internal Use Only, matching each variant against the query output so nothing outside scope is touched.
03
The Twin Engines
Separate Channel Formulas
Different Stores move at different speeds, so each channel gets its own par level formula instead of one shared number.
04
The Early Warning
Calculated Alert Threshold
The alert threshold is recalculated from the same consumption data, so reorder warnings rise and fall with actual use.
05
The Clean Count
500-Unit Rounding
Topping variants comes in 500 units each bag, so par levels are rounded to match calculation. That way, every target is a whole number of bags the team can actually send.
06
The Direct Line
Shopify Metafield Write-Back
Both values are written straight into Shopify metafields, where the 30-Day Demand Plan picks them up without any copy and paste.
07
The Weekly Pulse
Scheduled Recalculation
Stores are scheduled at different time of a week, with a consumption report shared to the team after each run.
What Changed
What changed under the hood
Before
Now
Before
Par level fixed at 4,000 for every variant
Now
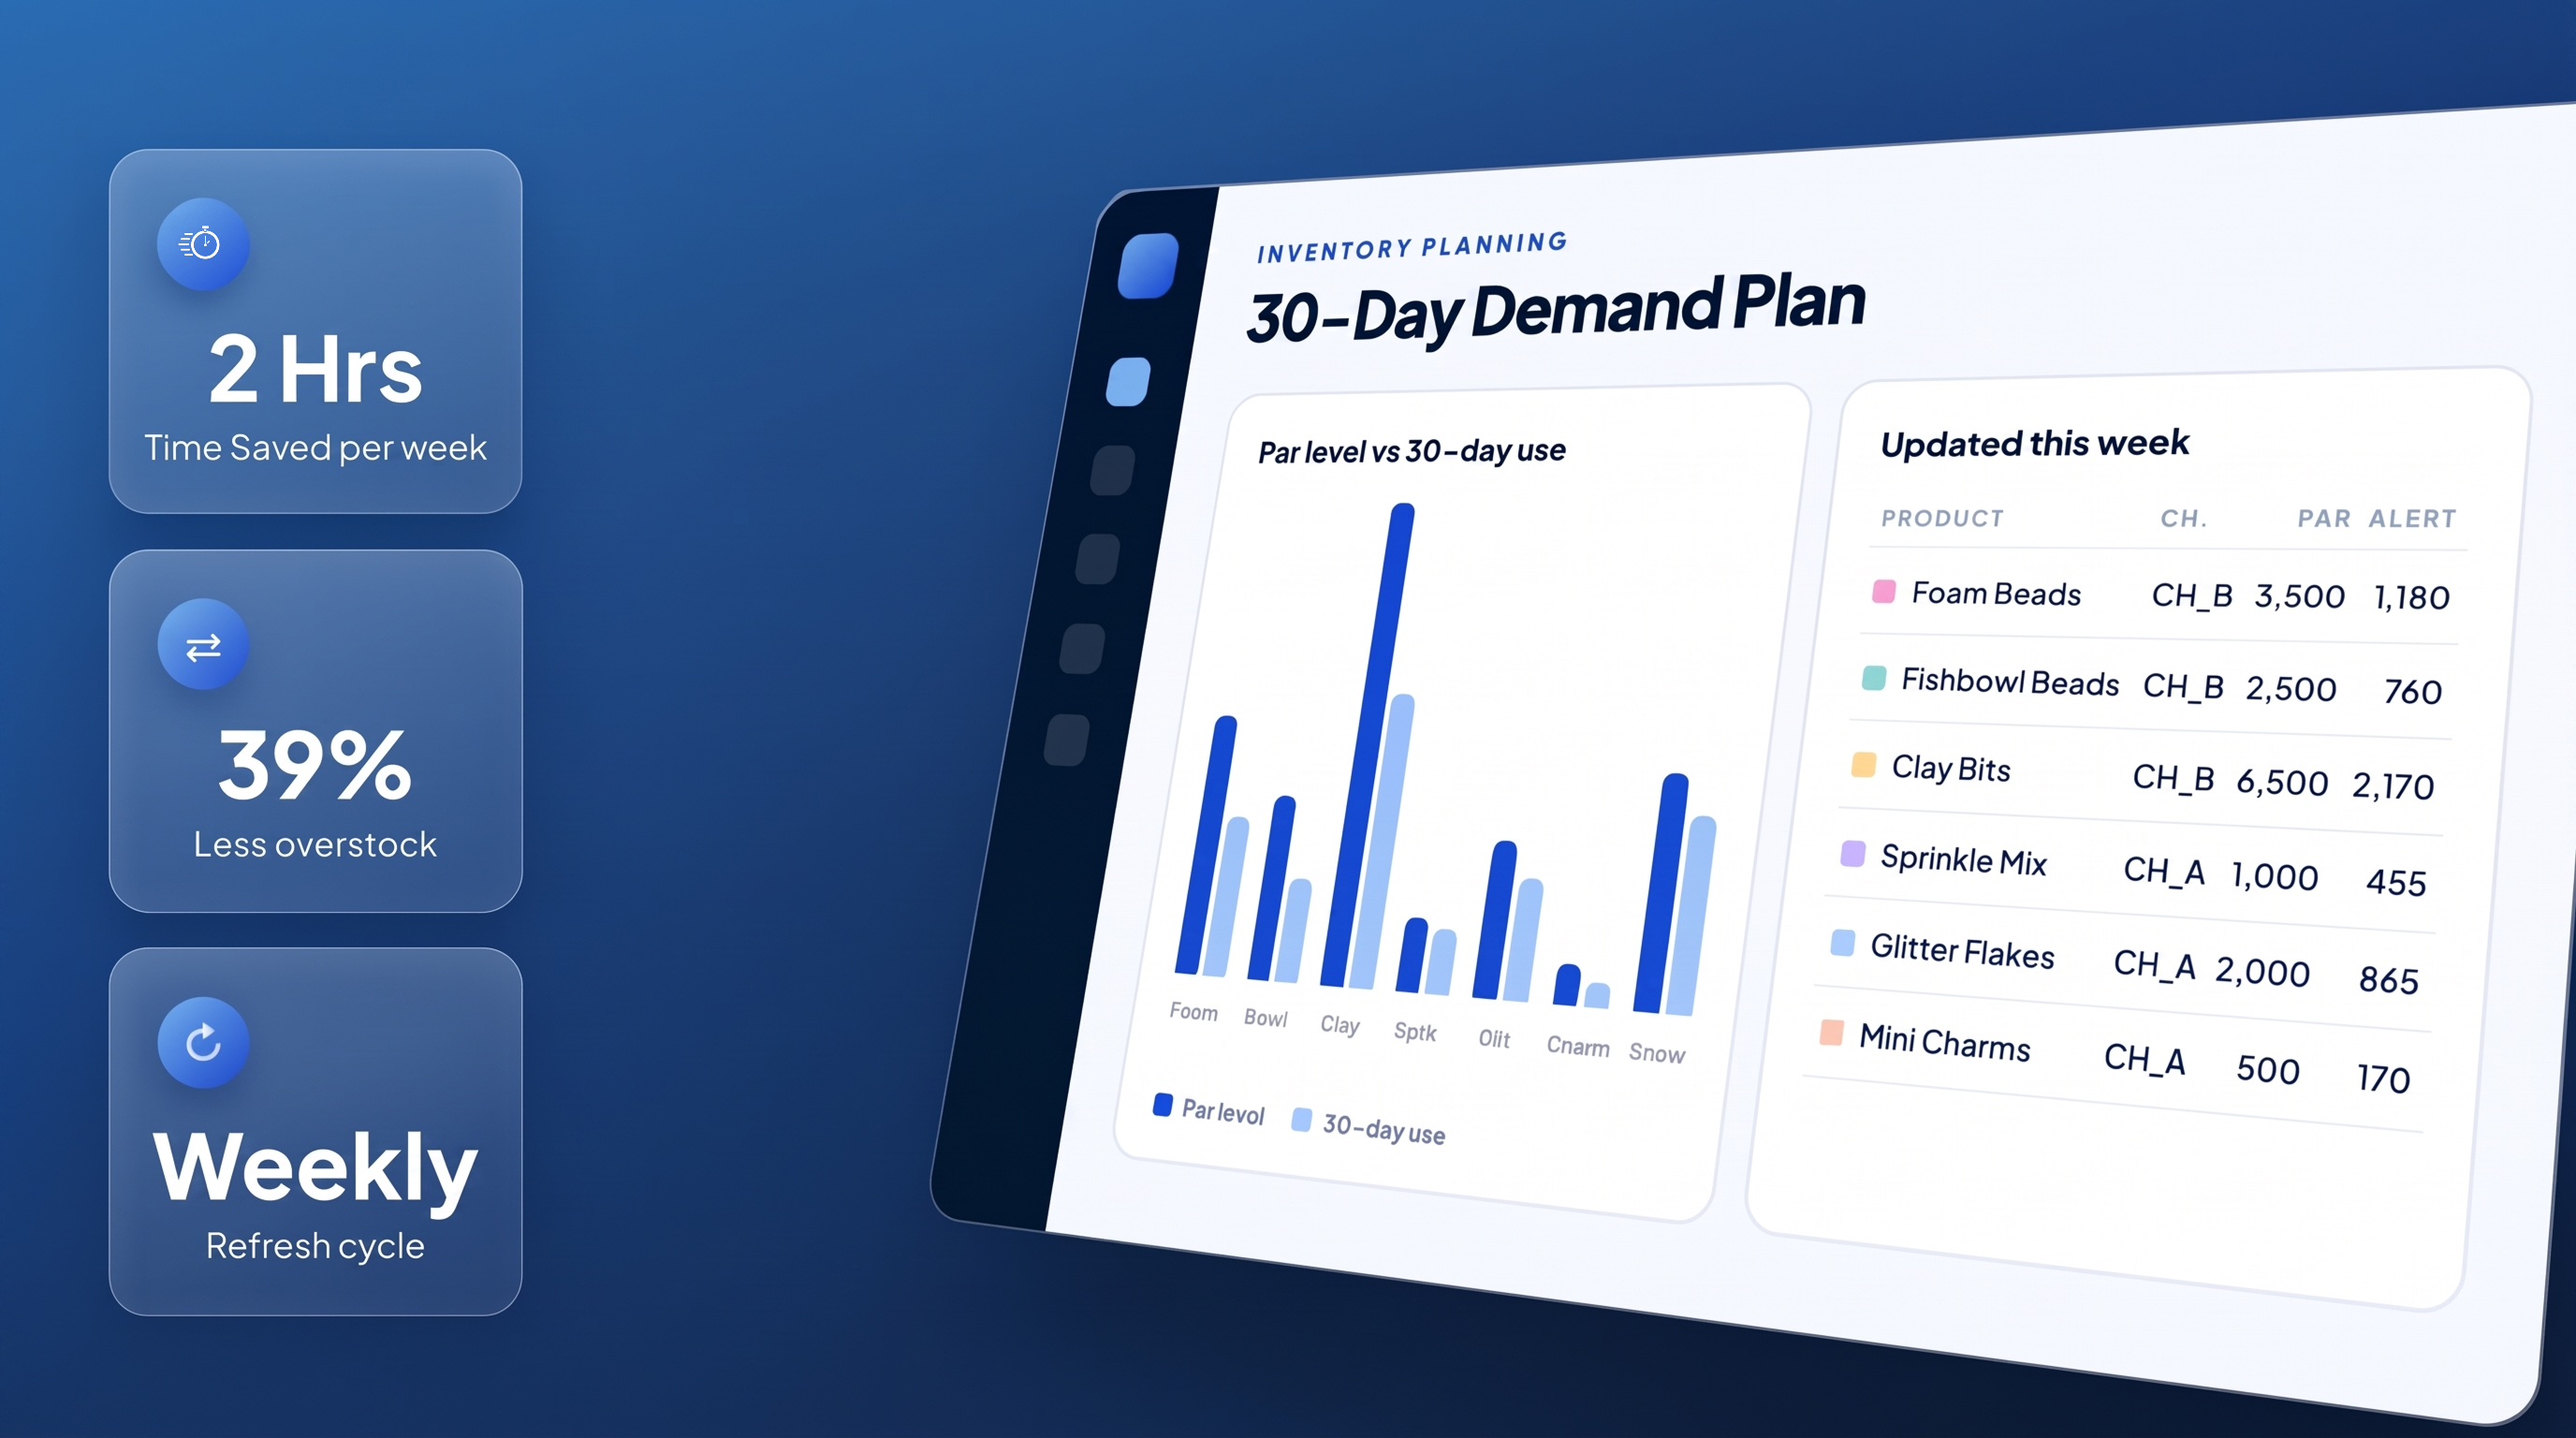
Par level recalculated weekly for each variant
Before
Alert threshold fixed at 2,000 everywhere
Now
Alert threshold recalculated weekly from real consumption
Before
No data source, just a static guess
Now
30 days of inventory adjustment history per product
Before
Same number for each of the stores are set once
Now
Formulas matched to each channel's restock schedule, updated weekly
The Results
What the numbers look like now
2 Hrs
Time saved per week
No longer spent reviewing and updating par levels manually.
39%
Less overstock
Reduction in excess units held on slow-moving toppings.
Weekly
Refresh cycle
All reports are scheduled on weekly basis and fully automatic.
Recent Case Studies


References
Documentation this build relies on
- 01
ShopifyQL inventory adjustment history
Schema used to read event-level inventory adjustments as consumption.
View Source - 02
Shopify Custom Data (Metafields)
How custom fields like par levels attach to Shopify products.
View Source - 03
Shopify Admin GraphQL: metafieldsSet
Mutation used to write par levels and thresholds back to Shopify.
View Source - 04
Google Apps Script Installable Triggers
Time-driven triggers that schedule the weekly report runs.
View Source

Get Started
Ready to automate your operations?
If your team is still spending hours updating spreadsheets, chasing suppliers or manually monitoring operational data, AutoBizz can help turn that process into a connected automated system.
Frequently asked questions
Still have questions? Book a call and we'll answer anything.
What is a consumption-based par level?
Why didn't Shopify's sales-based tools catch the problem?
Where does the consumption data come from?
Why do different stores need separate formulas?
How often are par levels and alert thresholds updated?
Can this approach work for other Shopify stores?