
Case Study
Your reports shouldn't freeze at rush hour!
Ecommarketing FZE × AUTOBIZZ
Ecommarketing FZE’s profit reporting lived in seven separate Sheets, each running its own script to pull its Sales and Ads data. As the business grew, the sheets slowed down, froze at peak hours and even counted some data twice. AutoBizz moved the heavy lifting and gave the team one fast dashboard they already know how to use.
“Clarity in business saves time, simplifies decisions, and creates space for growth”
Client
Ecommarketing FZE
Sector
E-commarce
Solution
Financial Dashboard Development
Timeline
September 2026
AutoBizz turned seven slow reporting sheets into one fast dashboard!
AutoBizz redesigned Ecommarketing FZE's financial reporting as a hybrid cloud system. Both the Sales and Ads data now flow into cloud system, where revenue, COGS, ad spend, ROAS and profit are calculated once, in one place. The team still works in Google Sheets, but instead of seven store-specific files there is a single centralized dashboard with all stores connected. The result is faster reports, no more double-counted ad spend, and a setup ready for growth without a costly custom web app.
- Google BigQuery
- Google Sheets
- Apps Script
- Shopify
- Meta Ads
- SQL
The Situation
Seven sheets, seven scripts, one growing headache
Ecommarketing FZE's reporting started the way most growing brands start: one Google Sheet and one script. Then came another store, and another sheet. Soon there were seven, each pulling its own copy of Shopify Sales data and Meta Ads data.
Services We Provided
- Inventory Tracking
- Dashboard Development
- Procurement Automation
Old Routine
- 01Each sheet runs its own script to pull Shopify orders
- 02Each sheet pulls the same Meta Ads data again, separately
- 03Formulas recalculate revenue, COGS, ROAS and profit in every file
- 04The team opens the right store’s sheet and waits
- 05Numbers get compared across files by hand to spot mismatches
Each step made sense on its own. Together, they meant seven copies of the same work. Every new store added more load, more scripts and more places for errors to hide.
'The sheets were never built to be a database. They just kept being asked to act like one, a little more every month'

The Challenge
Slow was annoying. Wrong numbers were the real problem
As the data grew, the sheets hit their limits. Reports froze at peak hours and ad spend was quietly counted twice.
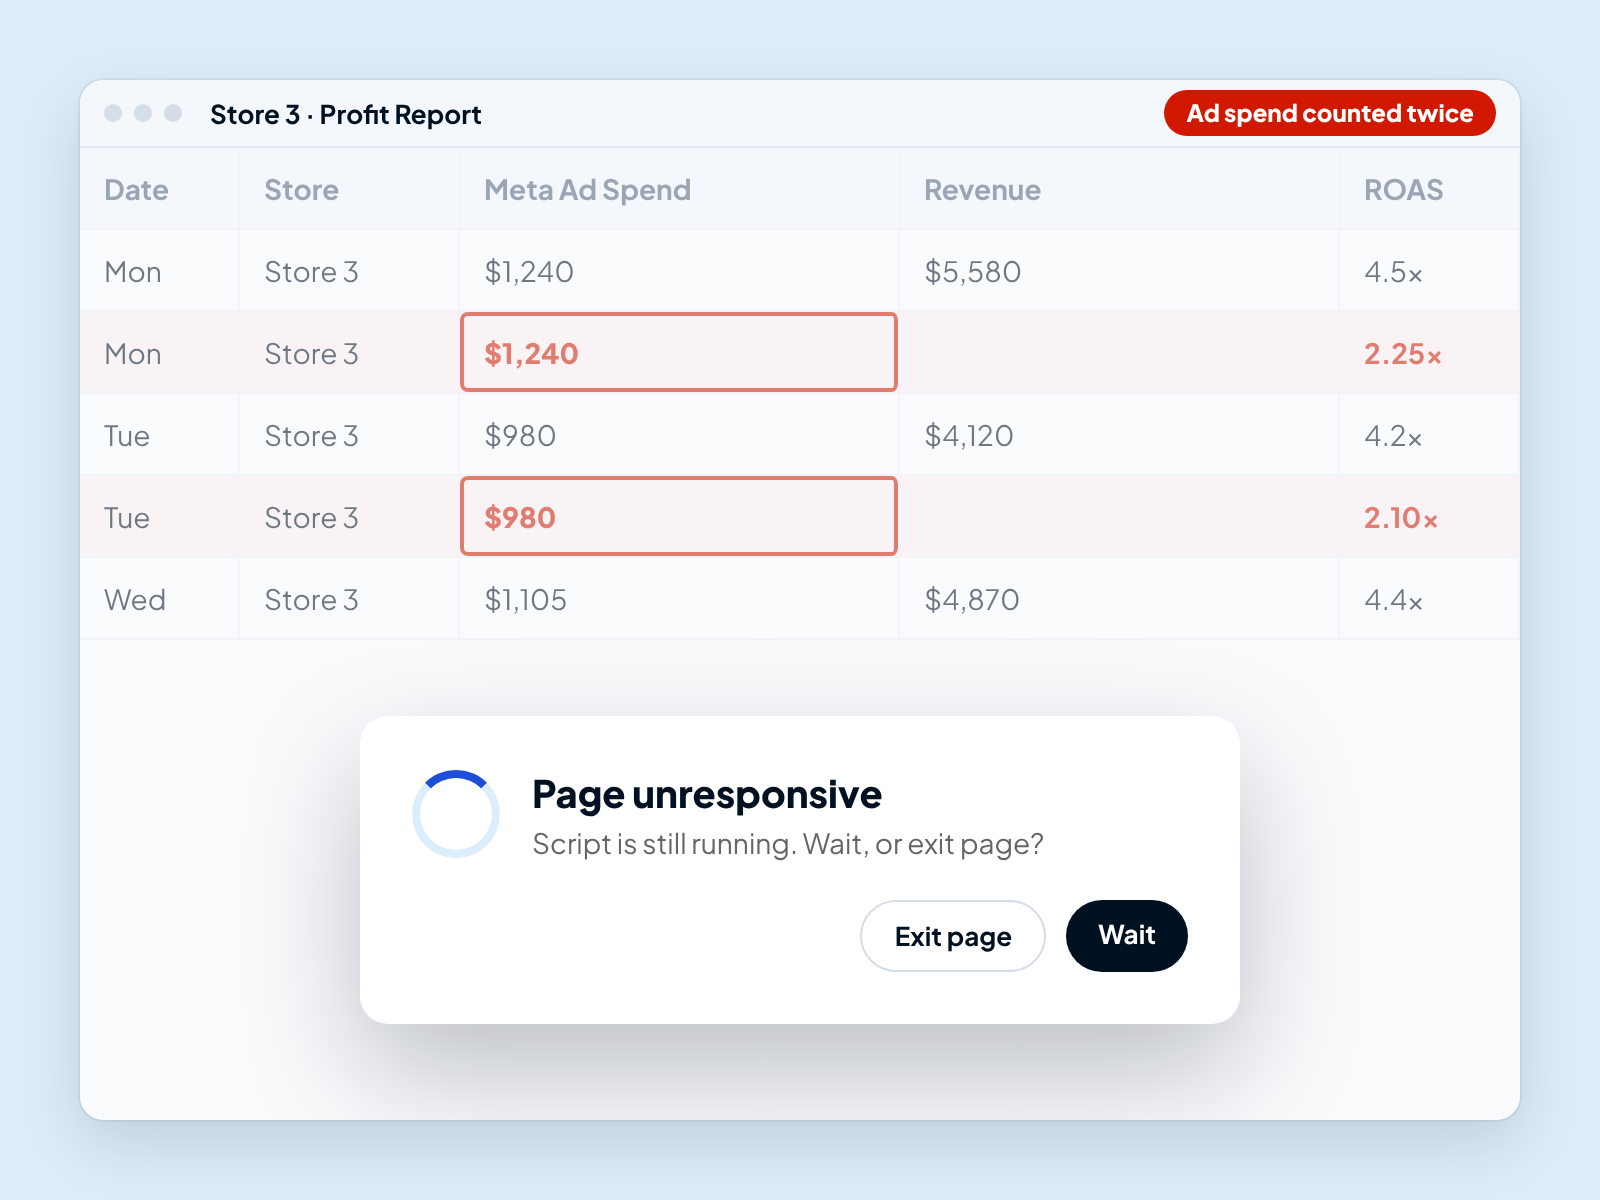
- Morning rushSeven scripts start pulling Shopify and Meta Ads data at once
- Peak hoursSheets freeze and the team waits for reports to load
- Report timeThe same Meta Ads spend shows up twice in the totals
- Decision timeROAS and profit look different from what really happened
- Trust spentThe team stops trusting its own numbers and double-checks everything by hand
System Architecture
The System Design Board
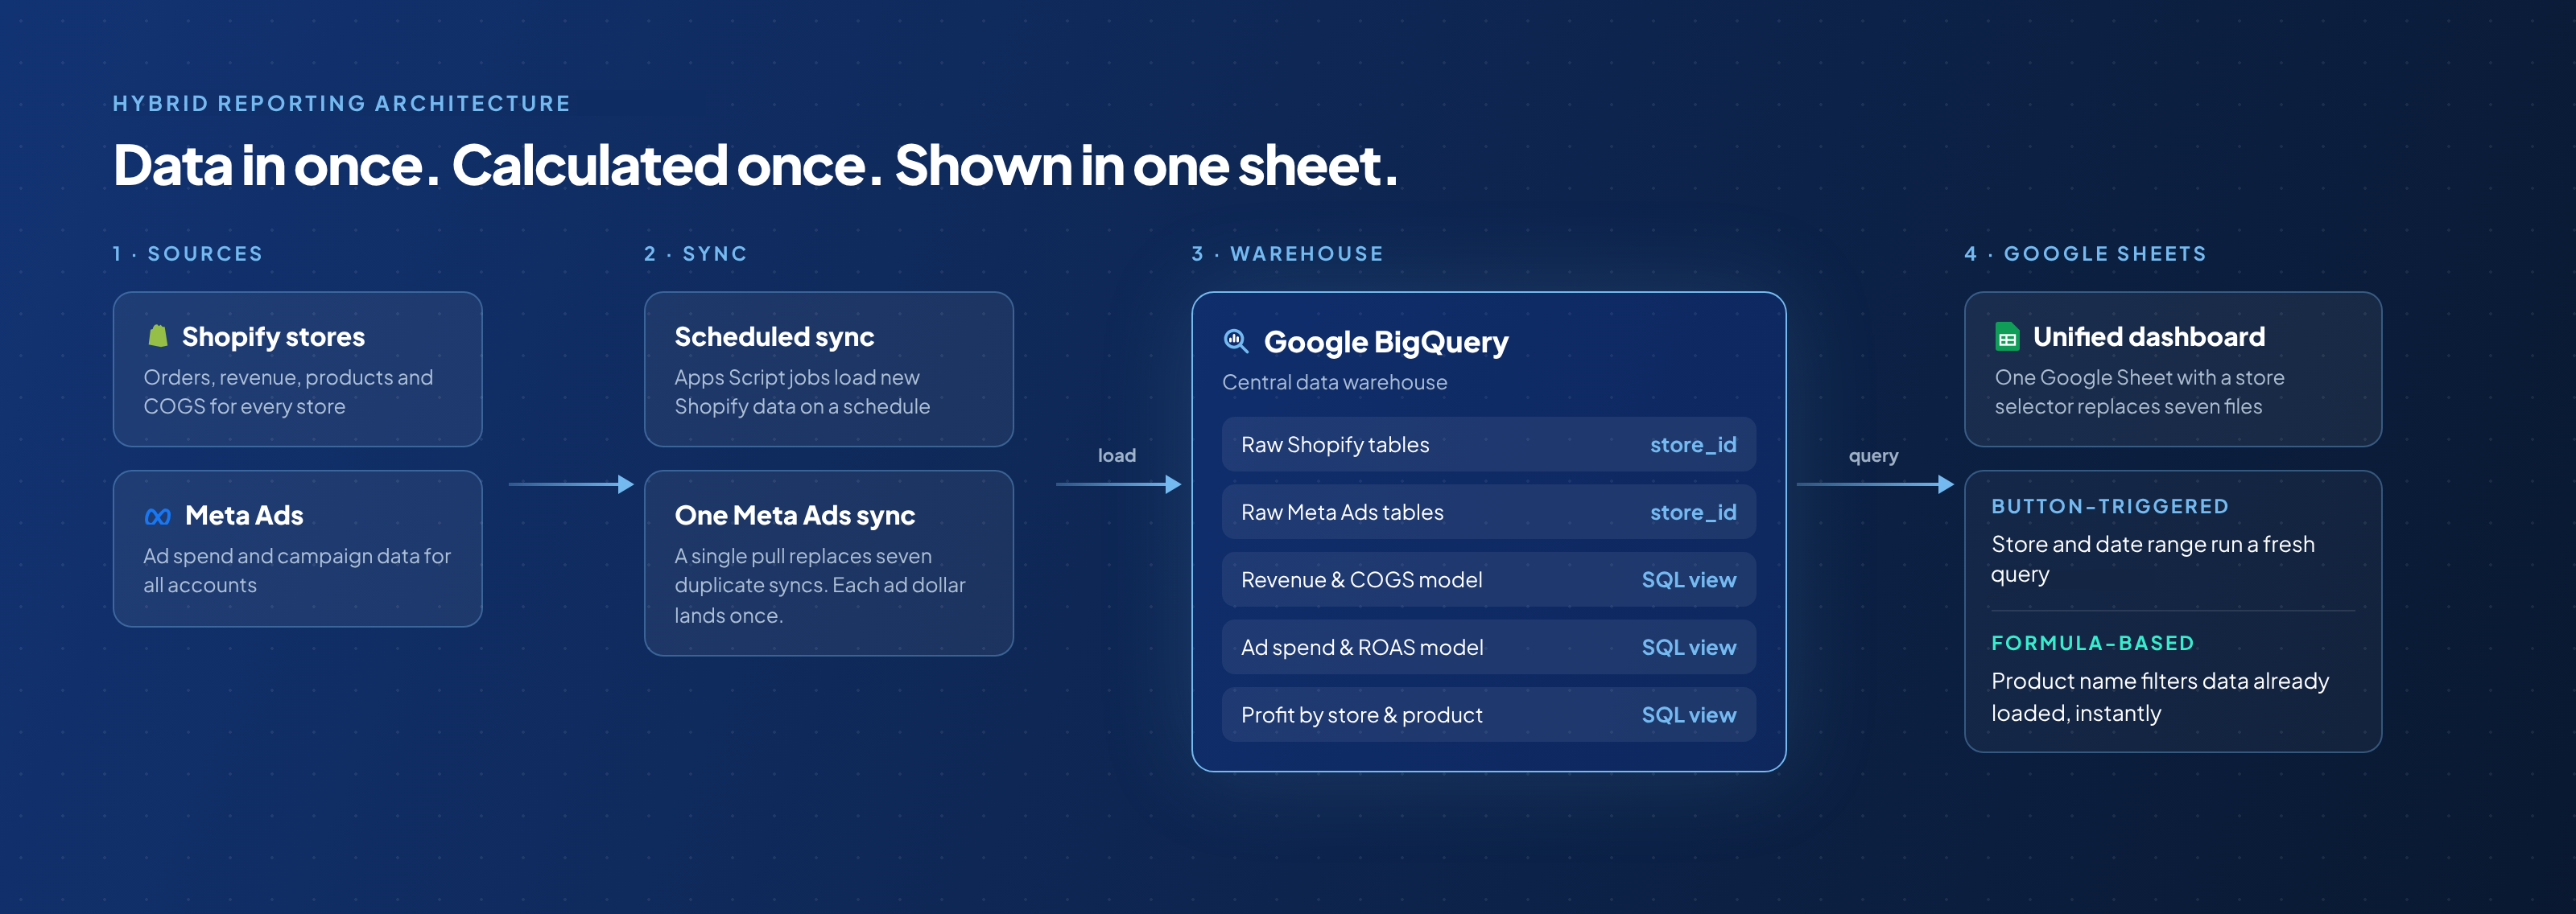



SEE THE DELAY BEFORE IT BECOMES A CUSTOMER PROBLEM
The Turning Point
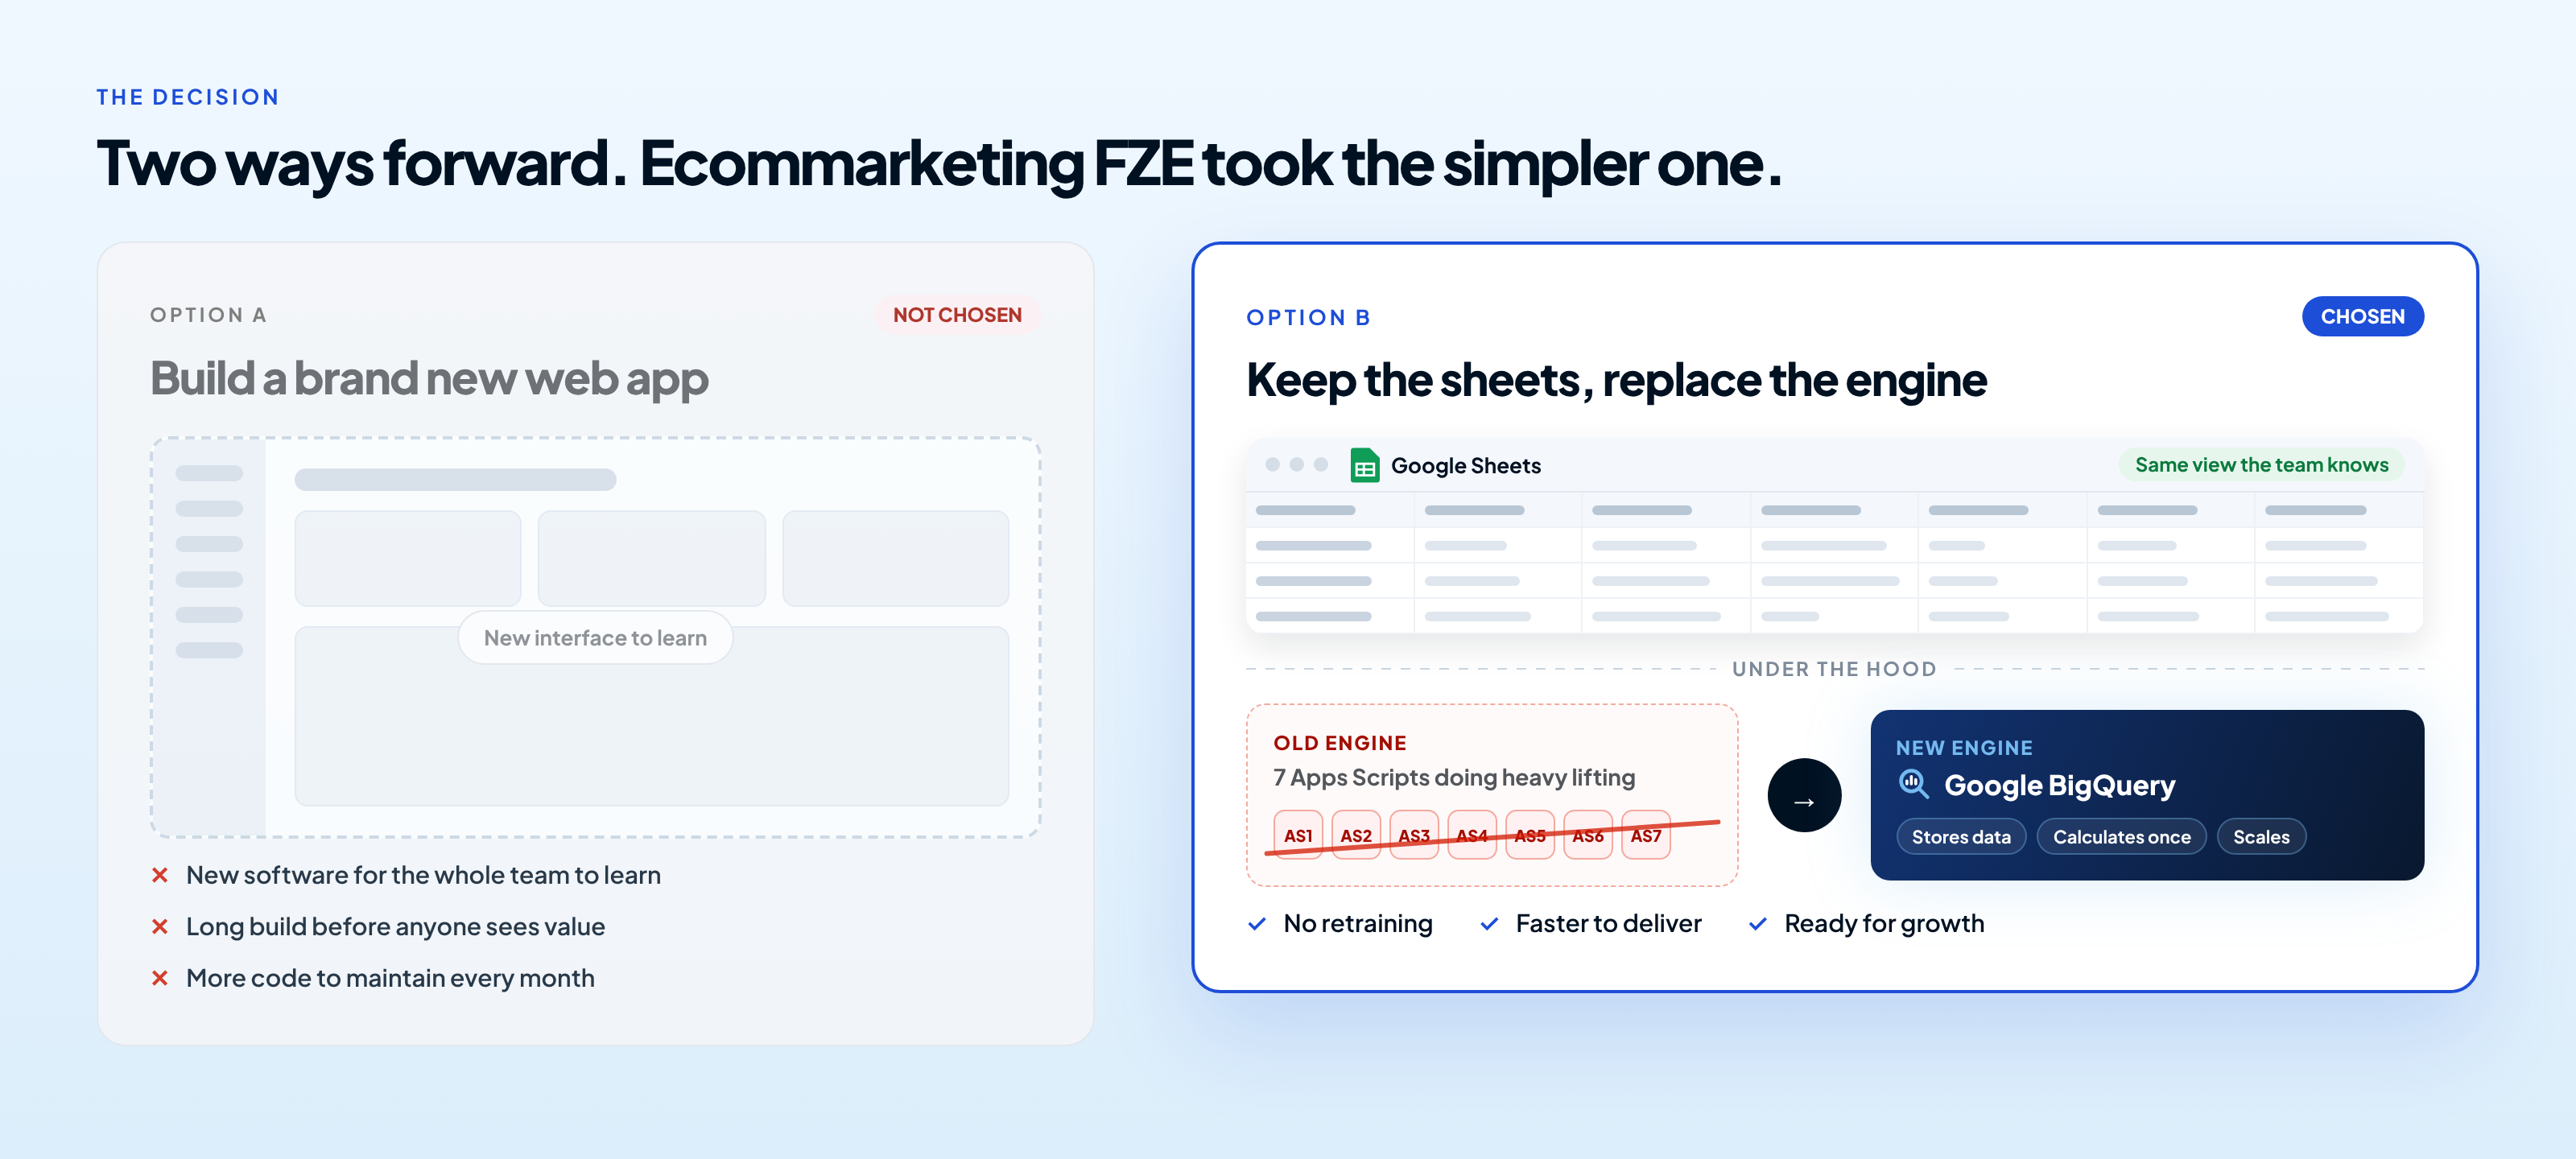
Keep the sheets, replace the engine
Ecommarketing FZE didn't need a brand new web app and a team retrained on new software. They needed the familiar sheet to stop doing a database's job. So the heavy data work moved to BigQuery, and Google Sheets stayed as the simple window the team looks through.
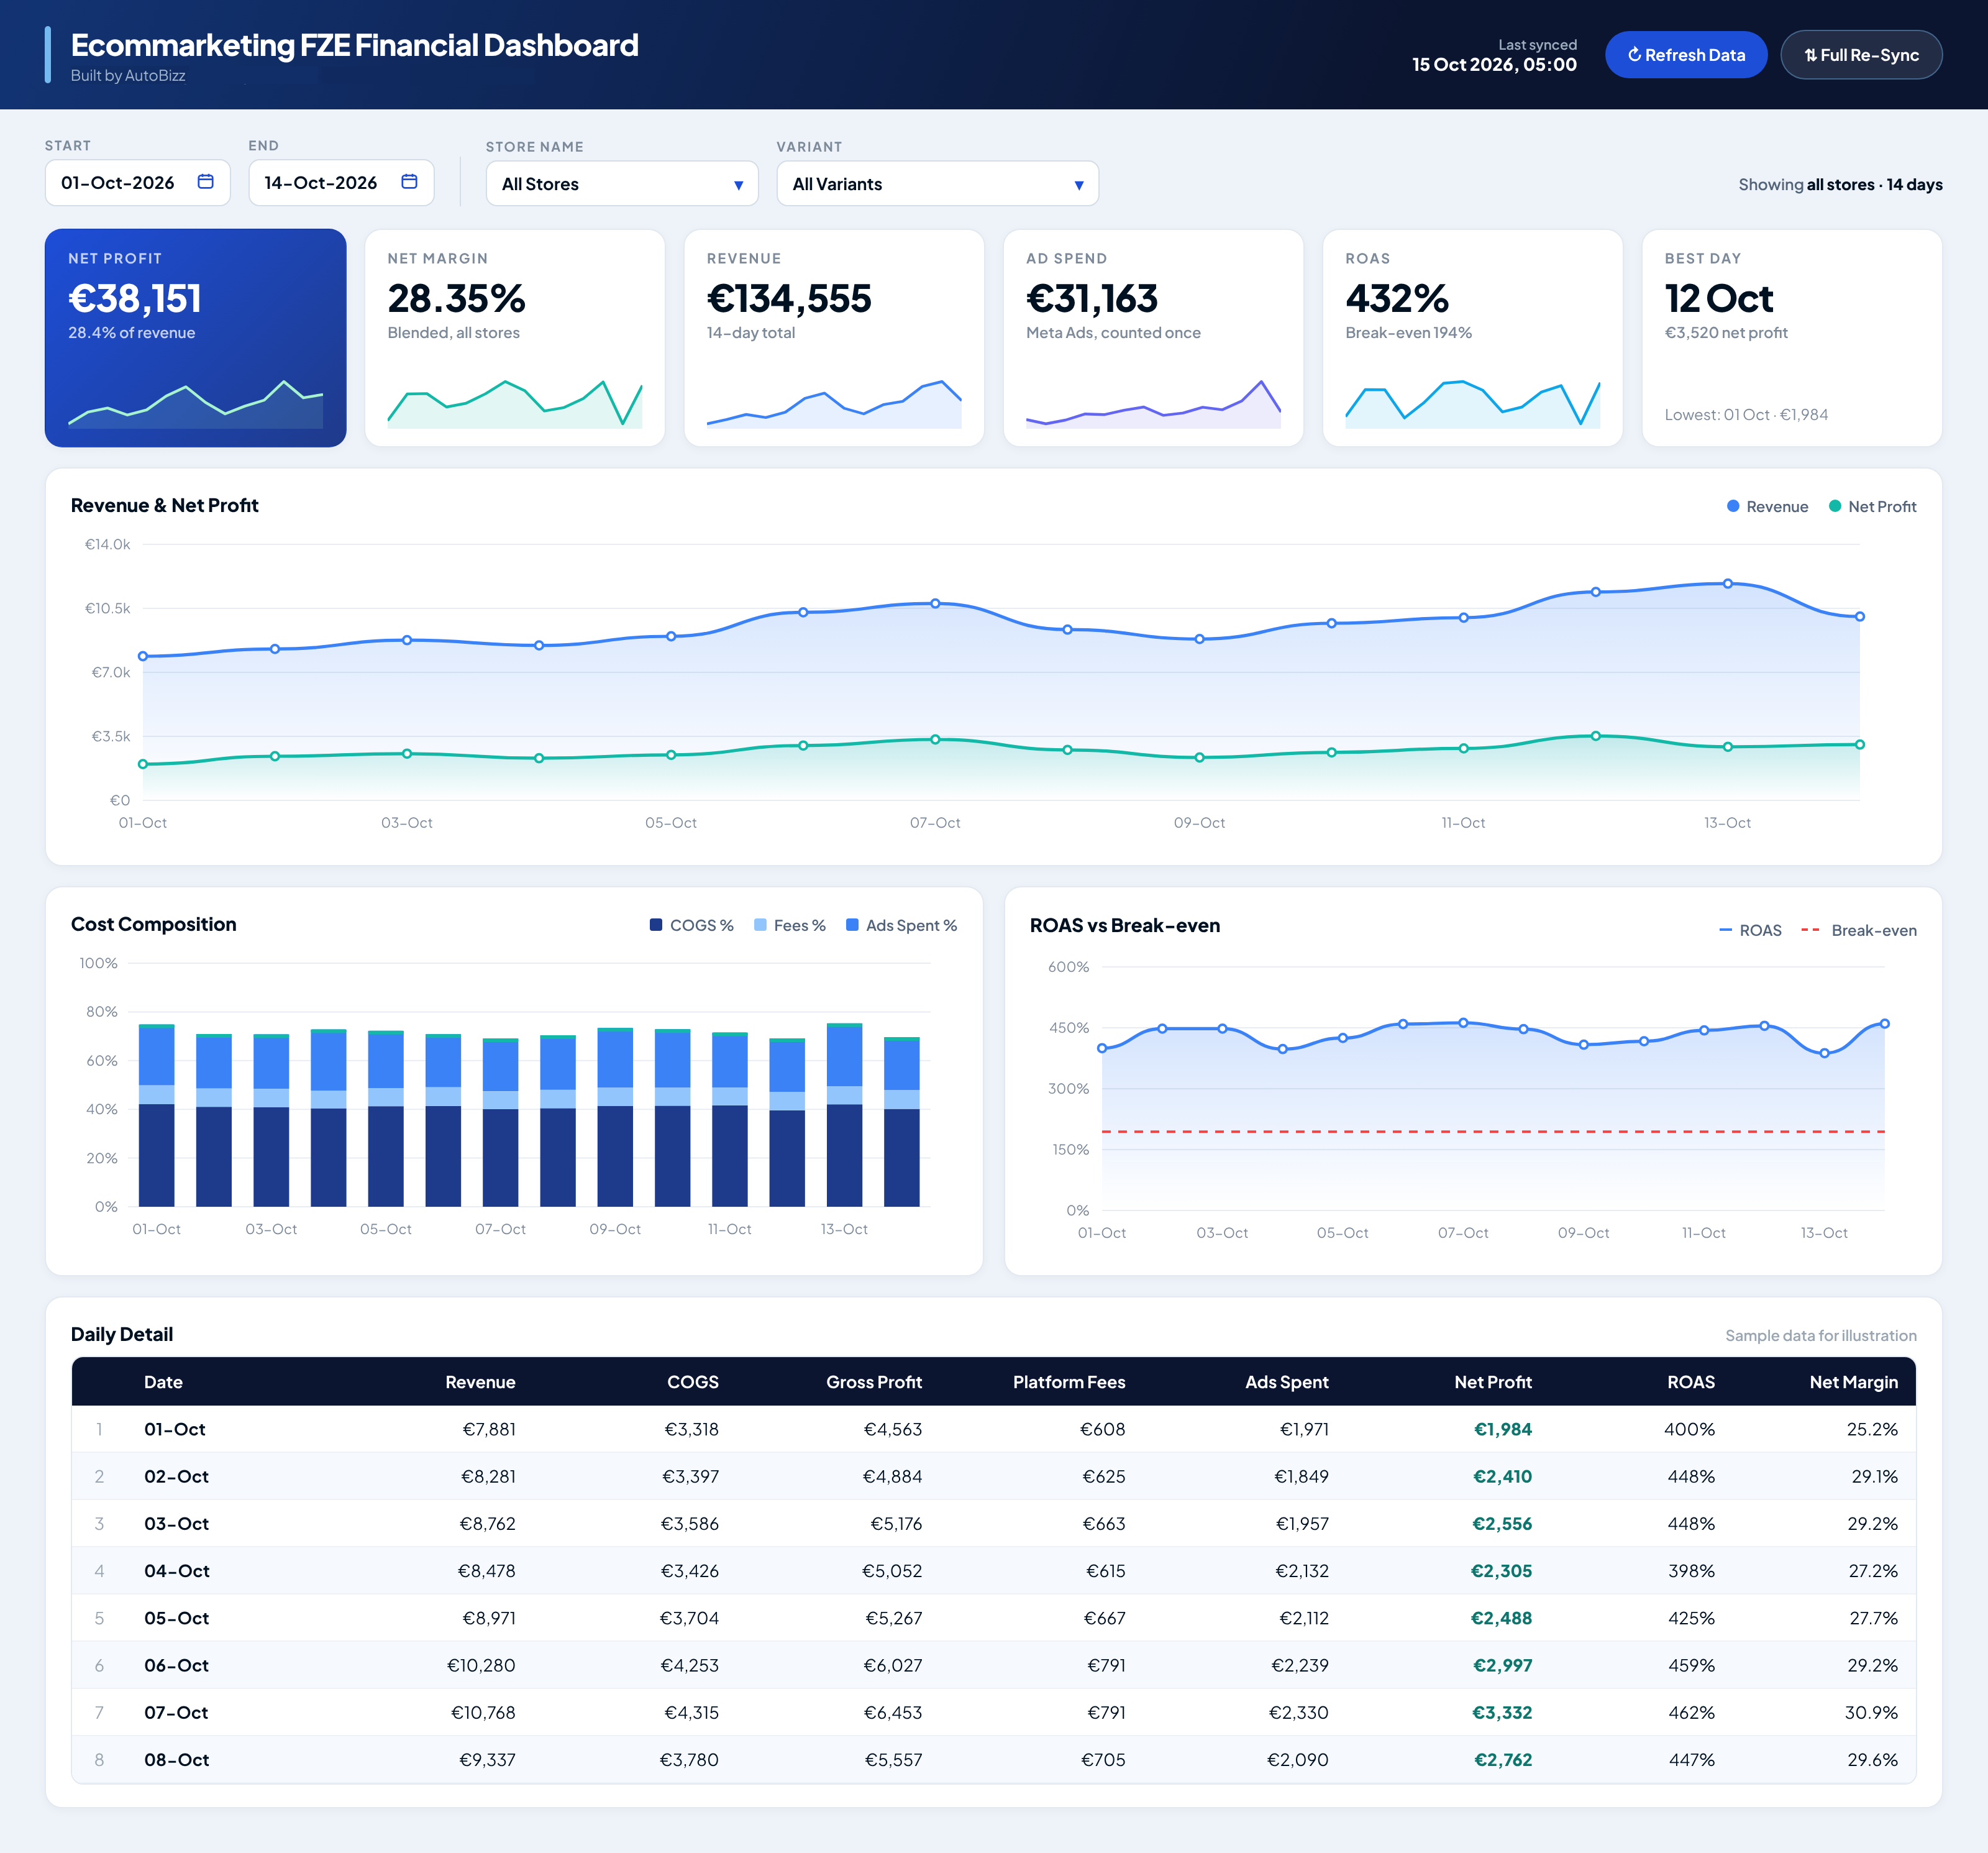
Interface Portfolio
The Dashboard we developed is working with full roar
The Solution
One warehouse and one dashboard for every store
AutoBizz redesigned the reporting stack around one simple rule: do the heavy work once in BigQuery, and let Google Sheets do what it does best, which is show it.
01
The Warehouse
Centralised BigQuery Backend
Shopify and Meta Ads data for every store lives in one BigQuery warehouse, so revenue, COGS, ad spend, ROAS and profit are calculated once, not seven times.
02
The Single Pipe
Consolidated Meta Ads Sync
One sync replaces seven duplicate pulls of the same Meta Ads data. Every ad dollar is recorded once, which ends the double counting.
03
The Front Desk
Unified Store Selector Dashboard
One Google Sheets dashboard replaces seven store-specific files. Pick a store from a dropdown and the whole report updates.
04
The Heavy Lifter
Button-Triggered BigQuery Filters
Big changes like store and date range run as a BigQuery query at the press of a button, so the sheet only loads what it needs.
05
The Quick Finder
Formula-Based Instant Filters
Small filters like product name use formulas on data already loaded, so results appear instantly with no extra query.
06
The Growth Room
Built to Scale
Adding a new store means adding data, not another sheet and another script. The system grows with the business.
What Changed
From frozen sheets to fast, trusted reports
Before
Now
Before
Seven separate sheets, one for each store
Now
One dashboard with a simple store selector
Before
Meta Ads data synced seven times over
Now
One sync feeds every store’s report
Before
Ad spend was sometimes counted twice
Now
Every ad dollar is counted exactly once
Before
Sheets froze during peak business hours
Now
BigQuery handles the load and sheets stay responsive
The Results
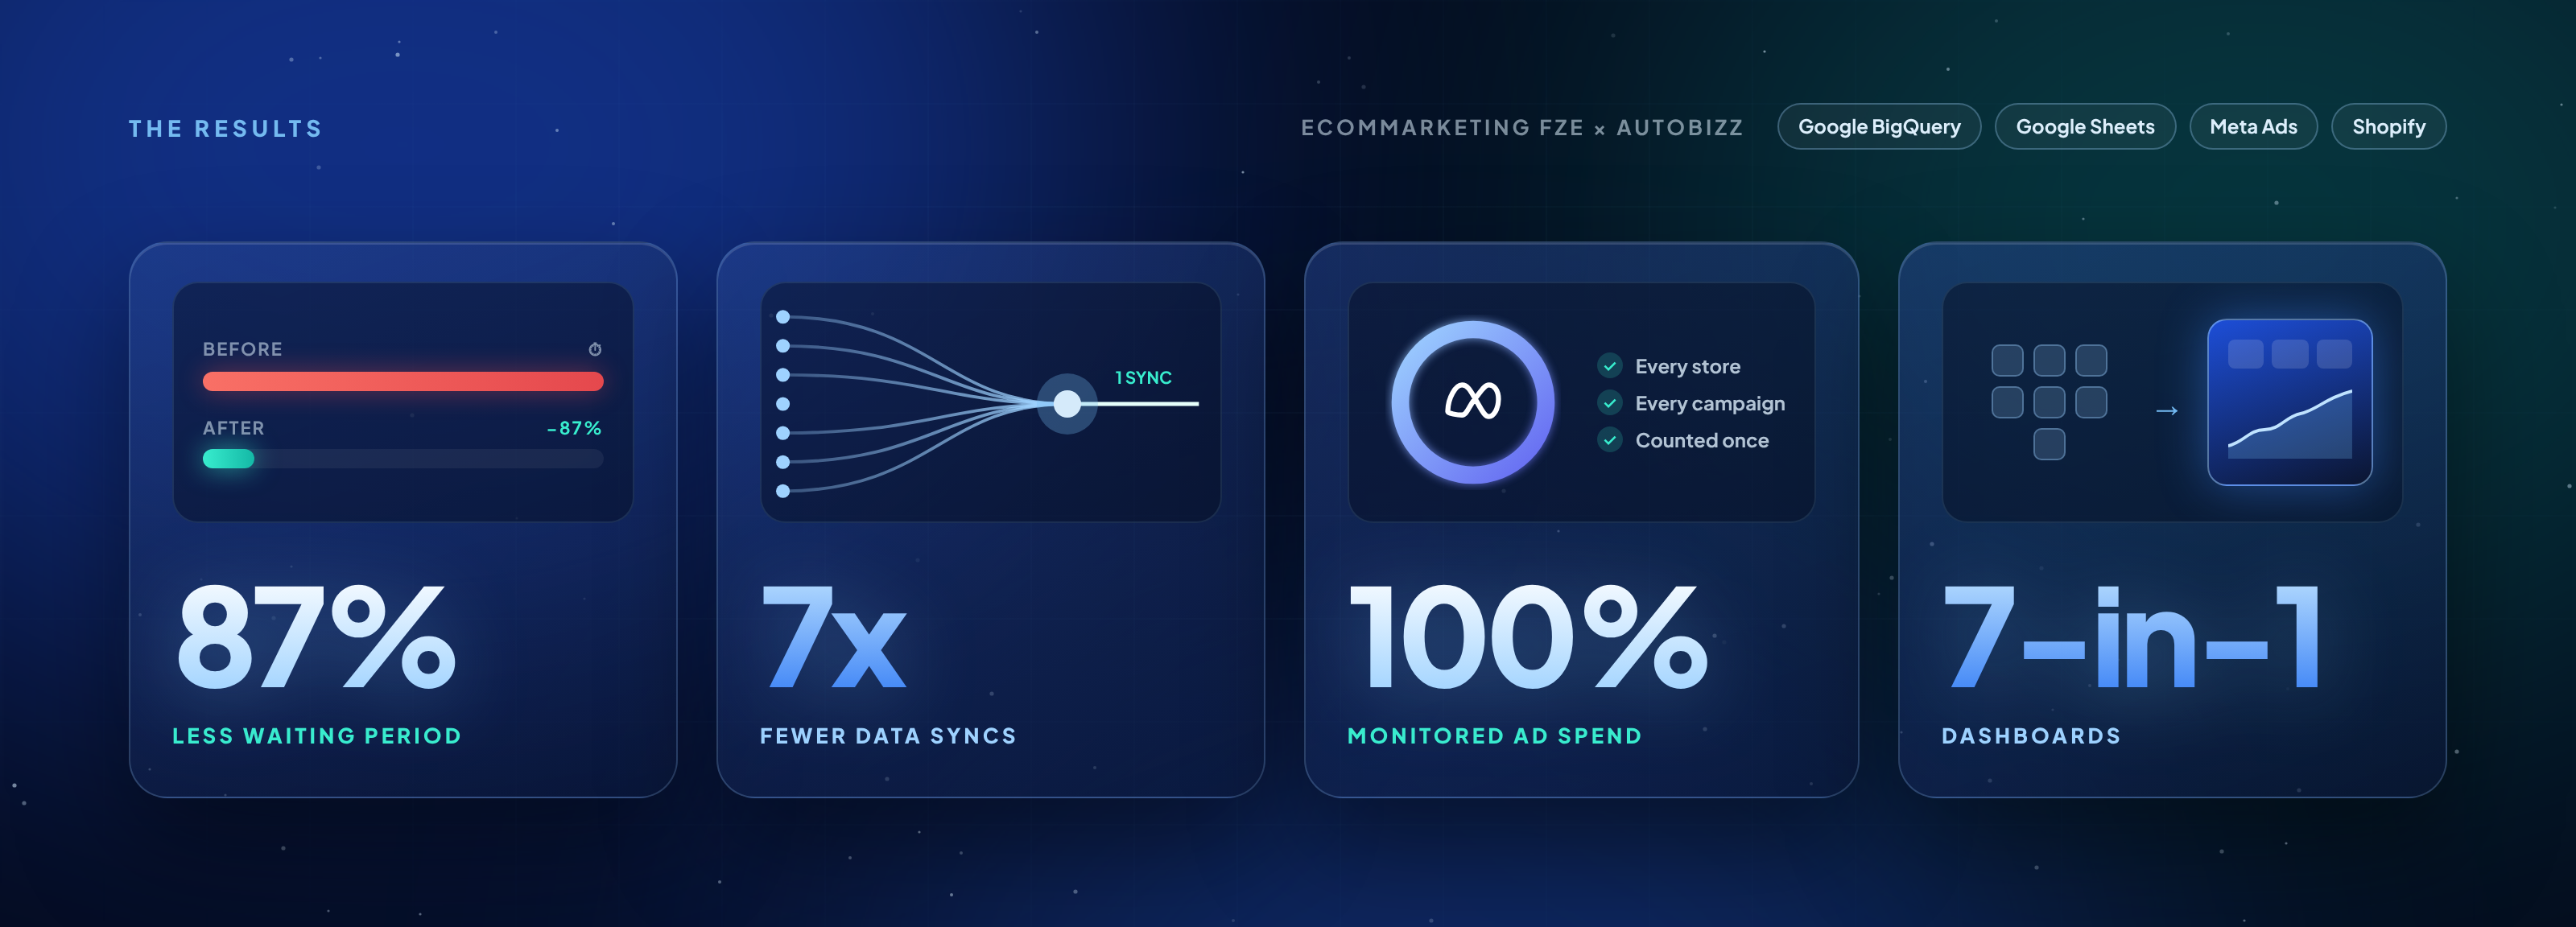
Simpler, faster and more accurate reporting
87%
Less waiting period
The reports now load faster, and filters and syncing process take less time than before.
7x
Fewer data syncs
One Meta Ads sync now does the work that used to take seven.
100%
Monitored ad spend
Every ad dollar are now monitored properly, so ROAS are finally showing true values.
7-in-1
Dashboards
Seven store reports now live in one fast, unified dashboard.
Recent Case Studies



References
Documentation this build relies on
- 01
Google BigQuery Documentation
The data warehouse that stores and processes every store’s data.
View source - 02
Apps Script BigQuery Service
Used to run button-triggered BigQuery queries from Google Sheets.
View source - 03
Shopify Admin API Documentation
The source of order, revenue and product data for each store.
View source - 04

Get Started
Ready to automate your operations?
If your team is still spending hours updating spreadsheets, chasing suppliers or manually monitoring operational data, AutoBizz can help turn that process into a connected automated system.
Frequently asked questions
Still have questions? Book a call and we'll answer anything.
What is a hybrid BigQuery and Google Sheets reporting system?
Why do Google Sheets reports slow down as a business grows?
How did AutoBizz fix double-counted Meta Ads spend?
Do teams have to stop using Google Sheets after moving to BigQuery?
What is the difference between button-triggered and formula-based filters?
Is a hybrid BigQuery setup better than building a custom web app?